Still, we do know three things that QE did not do. These are worth pointing out, especially since back when QE was just getting under way, there were people who expected that QE 2 would do all of them.
1. QE did not work according to the textbook model
One thing was never in doubt. As the Fed added massively to its assets, QE would cause an equally massive increase in the monetary base—the sum of bank reserves and currency that accounts for the bulk of its liabilities.
Some economists used to refer to the base as high powered money. It got that name from a familiar textbook model, according to which two simple ratios link the monetary base to the rest of the economy. One is the money multiplier, which is the ratio of ordinary money (M2) to the monetary base. The other is the ratio of nominal GDP to the M2 money stock, known as the velocity of circulation of money, or just velocity, for short.
If the money multiplier and velocity were constants, then the monetary base would be high-powered indeed. Any increase in the base (which the Fed can manipulate at will) would cause a proportional increase in nominal GDP. The only thing left to determine would be how much of the change in nominal GDP would express itself as an increase in real output and how much as inflation.
The idea of treating the money multiplier and velocity as constants is not completely silly. There have been times in recent history when one or both of those ratios were, in fact, reasonably stable. For example, for the whole period from 1959 to 1992, the velocity of M2 stayed in a narrow range between 1.7 and 1.9, with ups and downs from year to year but no obvious trend. Similarly, for most of the 1990s and 2000s, the M2 money multiplier stayed in a narrow range of about 8.0 to 8.4. (Is it a coincidence that the periods of maximum stability for the ratios did not overlap? Probably not, but I’ll save that rather technical issue for another post.)
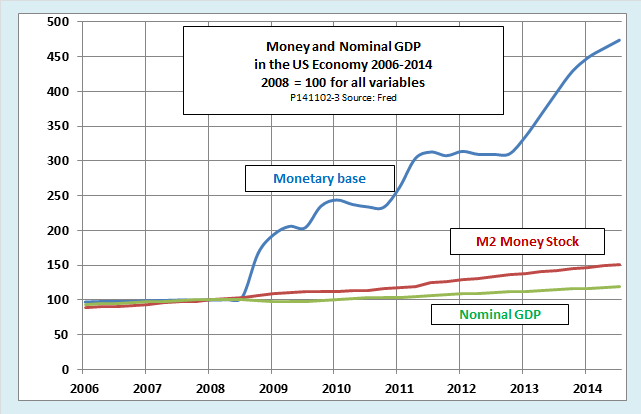
When QE came along, though, and when short-term interest rates fell effectively to zero, all hell broke loose with those deceptively stable ratios. Take a look at the following chart, which shows data for the monetary base, the M2 money stock, and nominal GDP. To make it easier to compare their trends, all three series are plotted with their value as of the first quarter of 2008 is set equal to 100.

Before mid-2008, the three series move closely together, as we would expect them to if the money multiplier and velocity were textbook-stable. Then, as soon as the Fed undertakes QE1, beginning in the second half of 2008, the series diverge. The monetary base soars as the Fed buys up vast quantities of financial assets, but the money stock barely budges. The divergence of those two series indicates a precipitous decrease in the money multiplier. Meanwhile, nominal GDP continues to fall for a year or so, and even after that, it grows more slowly than the money stock. The divergence of the money stock and nominal GDP indicates a decrease in velocity.
In short, the chart shows that in a deep slump, expansionary monetary policy is, as the saying goes, like “pushing on a string.” The Fed pushed and pushed, but the only thing it had the power to push was the monetary base, and that had very little effect on nominal GDP.
2. QE did not cause inflation
The sluggish reaction of nominal GDP to an increase in supposedly “high powered” money can be viewed as either a good or a bad thing, depending on your perspective. Back at the start of QE, not a few observers warned that QE would quickly lead to hyperinflation. That did not happen, and we can be glad it did not. However, it would have been nice if QE had boosted the growth of GDP by enough to bring inflation at least up to the Fed’s modest 2 percent target and, at the same time, to pull real output back to its potential and the job market back to full employment.
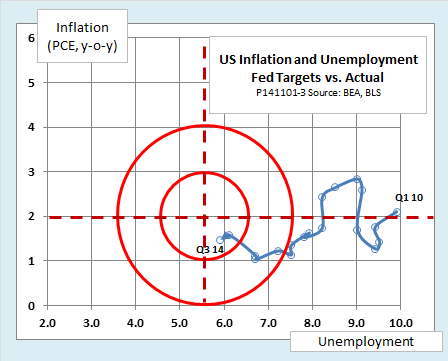
Instead, as the next chart shows, what we got was a painfully slow recovery of the real economy. The unemployment rate is still not all the way back to the 5.25-5.75 percent range that the Fed considers “full employment.” Meanwhile, inflation, as measured by the Fed’s preferred indicator, the deflator for personal consumption expenditures, peaked three years ago. Since then it has fallen well below its 2 percent target. When it looks at these data, the Fed sees enough progress to call an end to QE, but it is not as much or as fast as many of us would have liked.
3. QE was not powerful enough to overcome fiscal restraint
The policy experiments of recent years have given us a test of the relative strength of monetary and fiscal policy. Expansionary monetary policy and contractionary fiscal policy have gone at it head to head, with the outcome pretty much a draw. Fiscal policy has not been restrictive enough to derail the recovery completely, but neither has quantitative easing proved powerful enough to break decisively through the fiscal restraint.
Just how tight has fiscal policy been? The next chart shows the best overall indicator of the stance of fiscal policy, the structural primary balance, shown as a percentage of GDP. The structural primary balance is the deficit or surplus of the consolidated budgets of all levels of government as they would look at full employment, under current law and excluding interest on government debt. The current budget deficit—the indicator political discussions usually focus on—can be misleading, since it tends to increase automatically in a recession and decrease in an expansion even if there is no change in policy. The structural primary balance filters out cyclical effects to reveal underlying policy changes. A movement toward deficit shows added fiscal stimulus, while a movement toward surplus shows fiscal tightening.

If we compare this chart with the first one, we see that monetary and fiscal policies were pulling in the same direction during the downturn of the Great Recession, up to the middle of 2009. We can be thankful for that. Without QE1 and the combined fiscal stimulus programs of the late Bush and early Obama administrations, the recession would have been even deeper than it was. However, at about the same time the economy began to recover, fiscal policy shifted toward restraint, and has continued to move in that direction through this year.
What Ben Bernanke said a couple of years ago remains valid: “Monetary policy cannot achieve by itself what a broader and more balanced set of economic policies might achieve.”
The bottom line
This brief look at what QE did not do helps us understand why it is so hard to know what it did accomplish. It was an uncontrolled experiment. There was no way to apply QE to half of the economy and a placebo to the other half. Furthermore, for most of its life, the expansionary effects of QE were fighting against the contractionary effects of fiscal policy. It was a standoff, but there is no way to tell if that is because both policies were weak, or because both were equally strong. The most widely accepted conclusion about QE—that things would have been even worse without it—remains plausible, but since that is a counterfactual hypothesis that can never be conclusively tested, the debate will undoubtedly continue.
Related posts
Quantitative Easing and the Fed: A Tutorial (Slideshow)
Whatever Became of the Money Multiplier?
As We Move into Fiscal Chaos, Just How Bad is Our Fiscal Policy, Really?