The United States has experienced unprecedented increases in energy production recently, and political leaders from both parties have promised that greater energy abundance would bring back manufacturing jobs to the U.S. A study by PwC (2011) claimed that a high-level of shale gas recovery could lead to approximately one million more manufacturing jobs by 2025 when compared to low shale gas recovery scenarios. The U.S. Bureau of Labor Statistics appears to be considerably more skeptical and is forecasting a slight further decline in manufacturing employment by 2020 despite a considerable increase in real output (Henderson). What is the relationship between output and employment in the manufacturing sector and the supply of domestic energy? Can cheaper and more abundant energy reverse the long-term trend in manufacturing employment?
Manufacturing Output and Employment
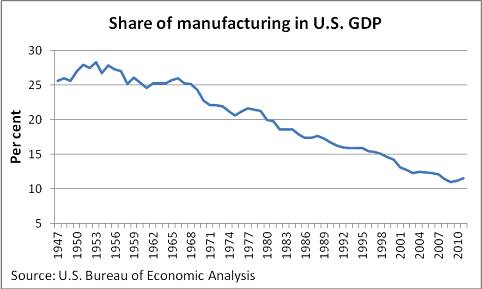
The share of manufacturing in U.S. economic output has been continuously declining since the 1950s (see the chart below). There has thus been no correlation between the price of energy and the share of manufacturing in U.S. GDP as, for example, this period includes both the oil price peaks of the 1970s as well as the “oil glut” period of the 1980s.

Total manufacturing employment in the U.S. has followed a long-term decline from 18.6 million in 1980 to 11.9 million in January 2013 (Bureau of Labor Statistics). In spite of the decrease in employment, manufacturing production (value added) increased during this period. Production increased because increases in output per worker dominated decreases in the number of workers employed in manufacturing. To the extent that Increases in worker productivity were a result of technological innovation, jobs will not come back. Millions of jobs in agriculture that were destroyed by mechanization have not come back. Destruction of jobs in one sector is part of the process of creative destruction that generates economic growth. To obtain the benefits from creative destruction workers must move out of the declining sector to an expanding sector. In the United States this movement has largely been out of manufacturing and into services, where more than 80% of Americans are now employed.
The same shift in employment from manufacturing to services has occurred in nearly all high income countries. China does not provide comparable employment data, but there is some evidence that even there the share of manufacturing employment is also decreasing relative to services (Economist). The relentless decline in manufacturing employment over long periods that included both increases and decreases in the price of oil casts doubt on the importance of oil for manufacturing employment.
Measurement Problem for Manufacturing Value-Added and Employment
Measurement of manufacturing output faces serious problems related to outsourcing and offshoring, though. If a domestic vertically integrated manufacturing firm employees its own designers to produce a new product, the resulting value-added is classified as manufacturing value added (Levinson). However, If they outsource design services by hiring a domestic design firm, the resulting value added is treated as services, even though the final product is identical in the two cases. The measurement problem becomes more severe when the domestic firm outsources to a foreign firm (offshoring), as is common with iPhones and many electronic products. Since American firms specialize in creating new products, providing finance and marketing services, and offshoring more labor intensive assembly, the measurement problem for U.S. manufacturing is especially severe. The U.S. firm creating the new product may or may not be classified as a manufacturing firm.
U.S. Oil and Gas Production
The increase in U.S. oil production in 2012 was the largest since the beginning of the petroleum era more than 150 years ago (Financial Times). The International Energy Agency has forecast that the U.S. will become the world’s leading oil producer by around 2020 and North America will become a net oil exporter by 2030. New technology (especially extracting oil from shale) has been a major source of production growth, and state governments have played a larger role in regulating new production than the federal government. The biggest increases in production of shale oil have occurred in Texas and North Dakota, which has now become the second largest state producing oil after Texas.
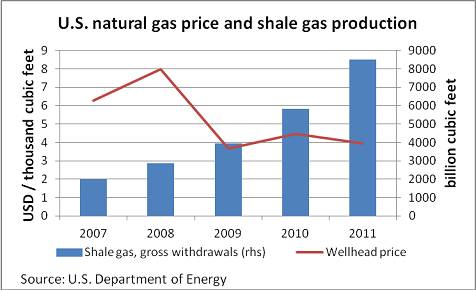
The production of shale gas in the U.S. from 2007 to 2011 has increased more than fourfold as can be seen in the chart below. In fact, the growth in shale gas production accounts for more than the entire increase in marketed production of U.S. natural gas from 20 trillion cubic feet to 24 trillion cubic feet during the same period. As a result of this rapid supply growth, natural gas prices in the U.S. have stayed low since 2009.
The Obama administration, like every administration since Nixon, has named Energy Independence as a policy goal. However, the efforts of the Administration have mainly involved subsidizing “green energy” that included some prominent failures, such as corn ethanol, Solyndra solar panels, electric cars (Tesla), and LG battery production in Michigan. Relative to shale oil, the administration continues to block the proposed Keystone Pipeline that would bring oil from Alberta to Texas, even though a change in the route of the pipeline has caused the governor of Nebraska to drop his earlier objection on environmental grounds. The observed increases in oil and gas production have occurred without direct support from the Federal Government.
How Long Could the Price Advantage Last?
How could U.S. manufacturers benefit from more abundant domestic sources of energy? Lower oil and gas prices would lower manufacturing costs, but with globalization in effect the price of natural gas or a given variety of oil in the longer term would tend to converge in all countries net of transport costs. Recent temporary differences between prices of Brent crude and WTI crude have been significant due to various bottlenecks in the transportation system and limited refinery capacity in the U.S. Even with that, if the price of WTI crude were to fall to $70 per barrel, the gain to the US buyer compared to a buyer in Europe will be limited to the size of the negative spread with Brent price plus the difference in transport costs. Globalization also implies that domestic oil buyers will be subject to the same price volatility with Energy Independence as they face now, although hedging techniques can be used to reduce it.
The differences in natural gas prices among countries and regions are much more substantial. According to the IEA “at its lowest level in 2012, natural gas in the United States traded at around one-fifth of import prices in Europe and one-eighth of those in Japan”. The U.S. gas prices have recently also been relatively less volatile than oil prices. In case of natural gas the price differences with the rest of the world are also likely to last longer. The study by PwC lists a number of investment projects, in particular, in the chemical industry that might be the direct result of the shale gas boom. However, price relationships between regional gas markets are set to strengthen going forward as other countries follow suit with respect to shale gas exploration and liquefied natural gas trade becomes more flexible. The long term contribution of the shale gas boom to raising manufacturing output in the U.S. is thus less certain. There has been an increase in manufacturing employment from 11.4 million in January 2010 to 11.9 million in January 2013, and some of it could plausibly be attributable to the shale boom (Bureau of Labor Statistics).
Redistribution of Jobs across States
At the same time as total manufacturing employment in the U.S. has been decreasing, there has been a major redistribution of jobs across regions. The general pattern has been from the Rustbelt to the Sunbelt, and the auto industry is a vivid example of the relocation of plants and workers. Nearly all the new plants are in the South or regions where labor unions are weak. Thus, if energy became more abundant, manufacturers might locate in states nearer to energy production or pipelines even if total employment remained constant. Buyers would gain from buying local energy, but the gain would be limited to differences in transport costs between distant and local sources.
Conclusion
Recent large increases in U.S. energy production may have important positive effects on economic output, at least in the medium term, but they are unlikely to reverse the long-term downward trend in manufacturing employment. At best they could stop it from declining further. Total manufacturing employment has been declining since 1980, and manufacturing employment as a share of total employment has been decreasing since the 1950s, for reasons not closely related to energy. Long-term increases in output per worker have contributed to the general pattern of increases in manufacturing output combined with decreases in manufacturing employment. Greater abundance of domestic oil and gas can affect the location of manufacturing employment across states though, even if it is unlikely to positively affect total manufacturing employment.
References
Bureau of Labor Statistics. 2013. http://data.bls.gov/pdq/SurveyOutput.Servlet.
Financial Times. 2013. “China Becomes World’s Top Oil Importer”. March 4.
Henderson, Richard. 2012. “Employment Outlook: 2010-2020. Industry Employment and Output Projections to 2020.” Monthly Labor Review. January.
International Energy Agency. World Energy Outlook 2012. Executive Summary.
Levinson. Marc. 2013.”US Manufacturing in International Perspective”. Congressional Research Service. Feb
PwC. 2011. “Shale Gas: A renaissance in US manufacturing?”. December.
The Economist. 2013. “’Served in China”. February 2.