“Inflation is creeping in. Businesses are holding back. People are up against the wall.”
“Those who live in ivory towers and pontificate about the ‘real’ economy while being totally removed from it should really experience how the 99 percent live.”
“If you believe the BS stats, you are in the minority. Consumers KNOW differently. Core CPI, etc. What a pile of cowdung!”
It is tempting to dismiss comments like these as simply ill informed, but that would be a mistake. Instead, we should take them seriously as an indication that when economists and consumers think about inflation, they ask different questions and get different answers.
The differences all stem from the fact that consumers look at what affects their pocketbooks–actual changes in prices as they happen. Economists, who instead are looking for what is relevant for policy, adjust the raw data to eliminate statistical noise that obscures underlying trends.
Seasonal adjustments are one example. When the BLS reports that the seasonally adjusted CPI for April did not change, it is giving an answer to the question, “Did prices change more or less last month than they usually do in April?” Only changes that differ from the April norm are relevant for policy. Policy operates on a time frame much longer than one month. There would be no point in adjusting interest rates or government expenditures just to offset price changes that happen each April as a matter of course.
In contrast, when consumers visit the supermarket or the gas station, they see unadjusted numbers. Just yesterday, I met a neighbor at the gas station who commented, “Wow! Look how much gas has gone up!” I was momentarily taken aback to hear this. Less than an hour earlier I had looked at the latest BLS report and noticed that it showed a 2.6 percent decrease in motor fuel prices for April. But, oops, that was the seasonally adjusted number. The unadjusted price of motor fuel went up by 1.8 percent in April. I realized that I was so used to looking at the seasonally adjusted data from the BLS that I had not even bothered to look at the numbers on the gas pump right in front of me. In fact, the CPI as a whole, not seasonally adjusted, rose at a 3.7 percent annual rate in April even though the seasonally adjusted change was zero.
It would be wrong, though, to think that consumers look exclusively at unfiltered data while economists apply filters. In fact, both filter the incoming data, but in different ways.
In their efforts to filter out statistical noise, economists go beyond simple seasonal adjustment and pay special attention to inflation measures like the core CPI, which removes prices for food and energy from the index. Food and energy prices move around a lot from month to month, so they obscure the policy-relevant trends economists are looking for.
Instead, consumers tend to ignore prices that do not change. As Daniel Kahneman notes in his book Thinking Fast and Slow, the tendency for our brains to focus on things that change or move has deep evolutionary roots. The eagle sees the running rabbit; the rabbit sees the eagle’s moving shadow and freezes, hoping to become invisible. Because they change often, food and energy prices are what consumers notice most. At the same time, they pay less attention to prices like those for manufactured goods, which have less month-to-month volatility. Not long ago, I wrote a post that drew attention to how little inflation there has been for the items found in a typical Sears Catalog—things like clothing and appliances. The response was spirited, to say the least. One comment after another insisted that the true indicators of inflation were milk and gasoline, not shirts and TVs. Yet, according to the BLS, “other commodities,” as a group, make up a larger share of consumer budgets than either food or energy.
There is another, even more important difference in the weights and filters that consumers and economists apply to changing prices. Economists treat price changes equally, regardless of their direction. As an example, consider another measure of underlying inflation, the 16 percent trimmed mean CPI published by the Cleveland Fed. That measure symmetrically removes the 8 percent of prices that increase most and the 8 percent that increase least each month, regardless of what they are. Since food and energy are not always the most active prices, some economists consider the trimmed mean CPI to remove statistical noise more effectively than the core CPI.
Consumers do not treat price increases and decreases symmetrically. Instead, they give more weight to those that increase than to those that decrease. Economists call this loss aversion. Using the previous month’s prices as reference point, consumers perceive any price increase as a loss and any price decrease as a gain. For changes of equal dollar value, the pain of an increase outweighs the pleasure of a decrease. For example, in applying loss aversion to the April data, we would find that people would feel the pain of increasing prices for fruit and vegetables more than the pleasure of falling prices for dairy products, and the pain of rising motor fuel prices more than the pleasure of the decreasing price of natural gas.
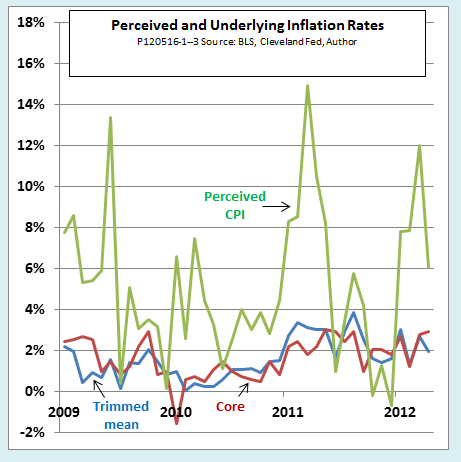
When we put all of these factors together, economists and consumers end up with very different views of inflation. The chart gives a visual representation of their different viewpoints using three versions of the CPI, all showing monthly values as annual rates. For economists, we show the seasonally adjusted core CPI (red) and trimmed mean CPI (blue). For consumers, we show a “perceived CPI ” (green).

To construct the perceived CPI, I began with the all items CPI, not seasonally adjusted, and modified it to simulate the effect of loss aversion. The importance of loss aversion depends on the degree of volatility of prices. As a measure of volatility, I used the mean absolute value of the difference between the monthly trimmed mean inflation rate and the all-items CPI without seasonal adjustment, which was .38 percentage points over the period in the chart. To reflect that fact that losses from price increases tend to be weighted about twice as heavily as gains from price decreases, I divided the volatility measure by two to give a 0.19 percentage point upward bias due to loss aversion.
The green line is certainly a lot more alarming than the red or blue one, but it is still not quite the whole story. One final consideration adds to the difference between the way consumers and economists perceive inflation. As economists see it, inflation causes pain only to the extent that it affects real purchasing power. If inflation raises nominal earnings at the same rate as consumer prices, it should cause no pain at all. That would have been the case in April, when real earnings did not change. Furthermore, as Tim Duy documented in a recent post, the April situation was typical, although there are exceptions in some periods and for some group of workers.
Consumers see things differently. They see increases in nominal earnings not as an effect of inflation, but as deserved rewards for their own skills and efforts. They then perceive any erosion of the purchasing power due to inflation as an undeserved loss. It follows that even if nominal earnings and the CPI rose by the same amount, and even if all prices changed at the same rate, inflation would cause pain.
The bottom line: The inflation measures that economists use may be useful in formulating policy advice, but they do not even approximately measure the psychological pain of inflation. At any rate, that is how I explain the constant stream of comments like “Your calculations seem like a magician’s trick to me,” “political manipulation,” “Gumint lyin’ to us again,” “you just don’t see what’s really going on,” and all the rest.